Six Lessons Learned from a Successful Design For Assembly Program
Six Lessons Learned DFA paper for May 2006 DFMA Forum.pdf (8 pages)
Each company works with Design for Assembly (DFA) methods for different reasons. Some companies want to take cost out of their products, some want to make more products in their factories, and some want to simplify the product to increase quality and reliability. In a growing market a company wants to reduce labor content to get more products through the factory to meet demand without adding assembly workers. And, in a growing market a company wants to reduce the required floor space required to meet demand without building another factory. Remarkably, the goals are similar for companies in declining markets, though the reasons are different. In declining markets, companies want to meet demand with the fewest assembly workers so work from consolidated plants can be brought into the factory without adding assembly workers. And, reduced floor space is desired to provide space for the work from the consolidated plants. In either case, a successful DFA program can help.
Done well, a DFA project can result in material and labor savings of 50%. But, it takes more effort to put in place a sustainable DFA program that becomes part of a company’s culture. Six lessons learned are described from a successful DFA program at Hypertherm, Inc., a privately-held company that designs and manufactures plasma cutting systems for the metal cutting industry.
1. The first DFA effort is leap of faith.
No matter how you slice it, the first DFA project is a leap of faith. Without guarantees and without certainty of results, someone in the organization must muster enough courage, or realize enough fear, to get the ball rolling. The most positive way for the leap of faith to come about is in response to a well-intentioned BHAG (big, hairy, audacious goal) issued from a company leader: “I want you to take 50% of the cost out of the next product”. Congratulations. You know have the reason to try DFA. You simply call a meeting of the top design leaders and tell them what you were asked to do – take out 50% of the cost on the next product. After their chuckles subside, ask them if they know they’re going to meet the BHAG. When they say no, you bring up the hair-brained idea of DFA. The design leaders will think your nuts because no one in their right mind can take 50% of the cost out of the product, especially with those simple-minded DFA tools. So, give them a couple days to think of another approach then call another meeting. If no one has a better idea (and they won’t), you get to try the DFA tools. This is the preferred method because less start-up momentum is required since all the team is doing is responding to an important company leader’s BHAG. No one wants to get in the way of that BHAG.
The non-preferred way of trying DFA is called the “DFA or bust” scenario. If the company will go out of business if costs are not reduced by 50%, then give DFA a try. What can you lose? Pressure will be immense since everyone’s job is relying on DFA, so surely you’ll have everyone pulling the boat in the same direction – DFA or bust.
2. Before DFA training, the engineering team must build the baseline product and create Pareto chart of part count by part type.
Design engineers believe that the last product they designed is infinitely good, just ask us. We believe that the product functions well and is easy to assemble. Customers know that the product doesn’t function perfectly (that’s for another time) and manufacturing knows that the product is difficult to assemble. However, design engineers rationalize the assembly weaknesses because “manufacturing builds them every day, so it must be easy”. For a successful DFA program, the design engineers must be convinced that there is room for improvement. However, no amount of discussion or argument can convince the design engineers that their product is difficult to assemble. It takes first hand experience to convince the design engineers that their design is sub-standard from an assembly standpoint.
First hand experience is obtained only on the product floor. Send the design engineers out to the production floor to build the baseline product under production conditions. Production tooling and production documentation are used and production build times must be adhered to. When the design engineers come back to their desks tired and bloodied after their experience of building the baseline product, the convincing is almost complete. The design engineers have new-found respect for the assembly workers and new-found disrespect for the baseline product. It’s now time to complete the convincing phase by exploiting their “data-driven approach to life” by asking them to create a simple chart called: the Pareto chart of part count by part type.
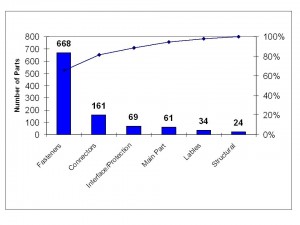
The first step in creating the Pareto chart is to have the design engineers create part types for the parts, e.g., fasteners, connectors, interface/protection, main parts, labels, and the like. Then the design team assembles the baseline product (again), counts each part and assigns the parts to a type. This process is painstaking and worth the expense. Figure 1 shows an example of a Pareto chart or part count by part type.
Once the chart is completed and the design team tries to figure out how on earth so many parts were stuffed into the product while they weren’t looking, the design team has a signature of the design and the plan of attack is clear. Also, they have a good objective measure of the baseline design. From Figure 1, with about 80% of the parts being fasteners and connectors, the plan of attack is to reduce fasteners and connectors first. Though this is always the first place to attack, the design engineers have their data and they know how to proceed.
Figure 1. Pareto chart of part count by part type for the baseline product’s main power supply in a plasma cutting system.
3. Set an explicit goal of 50% part count reduction to focus and drive the DFA effort.
A simple goal goes a long way toward focusing the DFA efforts. Without a doubt, a part count reduction goal is the best place to start. There are two reasons to focus on part count reduction. First, part count reduction is the mechanism for eliminating labor content. There is no design tool that takes labor content out of a product. Instead, reduced labor content is the result of something – part count reduction. DFA takes parts out of the product and reduced labor content follows. Second, part count reduction is easy to measure and people can understand it. No other goals are required.
The leader must now walk the walk. So, with a stiff upper lip and a straight face, actively promote the mantra: “Take out 50% of the parts”. In fact, since you know the number of parts in the baseline product, you can translate the 50% reduction mantra into an explicit number of parts. In my case the first product had about 1000 parts and everyone on the design team knew how many parts the new design was going to have – 500. So, at every opportunity, at every turn, at every meeting, in the cafeteria, while on a lunchtime run, tell the design team how many parts the new product will have.
You must remember, that the design team still thinks you’re out of your mind, because no one can take 50% of the parts out of the product. The best way to get past this phase is to acknowledge that you’re out of your mind, and then train them in DFA. At any flare-up of discontent you can always ask the disgruntled engineers if they have a better idea. That usually shuts them up until the training is complete.
4. Part count reduction is a surrogate for reduction in non-value added (NVA) activities
Non-value added (NVA) activities, or activities that the customer will not pay for, or waste, are best understood by the Lean thinkers who lead the daily crusade against NVA activities. Lean thinkers have the mindset and the toolbox to eliminate NVA activities throughout the organization. The NVA activities were first grouped into seven wastes by Ohno1 (see Table 1) and elegantly described in cartoon format by Suzaki2 (see Figure 2). The Lean thinkers have largely been relegated to NVA reduction on the manufacturing floor where the Value Stream Mapping (VSM) is the tool of choice to define the activities, resources and information flow required to deliver value to the customer. What’s different about the Value Stream Map is that a time is put to every activity in the value stream and each time is defined as value added or non-value added (NVA). It’s common for NVA time to be far more than 95% the time in the value stream. Since NVA time makes up most of the time in the value stream, there is a huge time savings even with modest percentage reductions NVA time.
Table 1. Seven Wastes, from Ohno
1. Waste of overproduction (of parts)
2. Waste of time on hand – waiting (for parts)
3. Waste in transportation (of parts)
4. Waste of processing itself (parts)
5. Waste of stock on hand – inventory (of parts)
6. Waste of movement (from parts)
7. Waste of making defective products (using parts)
Figure 2. Cartoon of two wastes, from Suzaki.
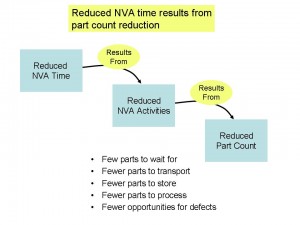
The Lean toolbox cannot simply erase NVA time from the value stream; reduction in NVA time is the result of something – a reduction in the NVA activities themselves. And, since the NVA activities (described by the seven wastes) are strongly linked to part count, reduction in NVA activities results from reduction in part count (among other things). This causal chain is shown in Figure 3.
Figure 3. Causal chain of NVA time, NVA activities and part count.
However, the design teams have been isolated from the Lean initiatives, and part count reduction efforts have not been part of the Lean equation. But, even without the design teams, the manufacturing floor has generated significant savings. It is amazing, however, to imagine the savings if the design teams get involved. Their involvement would result in fewer parts to over produce (make the wrong ones), fewer opportunities to wait for late parts, fewer parts to ship, fewer to receive, fewer to move, fewer to store, fewer to handle and fewer opportunities for incorrect assembly. If you open up your mind, the list broadens: fewer suppliers, fewer supplier qualifications, fewer late payments, fewer supplier quality issues, fewer expensive Black Belt projects. Most important, however, may be the reduction in transactions associated with reduced part count, e.g., work in process tracking, labor reporting, material cost tracking, inventory control and valuation, BOMs, backflushing, routings, work orders and engineering changes3. So, focus on part count reduction.
To close this line of thinking I want to mis-quote a good friend: “As a design engineer, I can design in more waste in one afternoon than a sea of manufacturing engineers can take out in a lifetime”.
5. Measure floor space productivity.
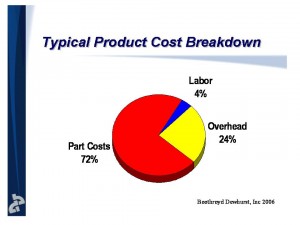
Figure 4 shows a breakdown of product cost which is the average of multiple hundreds of products 4. Though the breakdown is not correct for any one product, it may be a sufficiently good estimate for talking purposes due to the large sample size. It’s clear from the graph that the labor component is small. Therefore, the relative savings from Labor reduction is small (though that won’t stop most from fixating on labor savings). The next largest slice is Overhead.
Figure 4. Cost breakdown from multiple hundreds of products 4.
Each company calculates Overhead costs differently, and the calculations usually artifacts of traditional cost accounting practices with limited physical interpretation. Frankly, it confuses the hell out of me. Overhead costs are a business metric that is far removed from the actual activities occurring on the production floor. What is needed is a straight forward process metric that is easy to understand. Floor space productivity is a good one. Floor space productivity (FSP) is defined here as the profit dollars shipped per unit time divided by the floor space to achieve the profit (show in equation 1). If the time interval is one day, the units of FSP are dollars per day per square foot.
Floor Space Productivity (FSP) = profit per unit time / required floor space (eq. 1)
FSP is a simple metric that has a clear interpretation, meaning everyone understands that increased profit is good and everyone understands how to measure floor space. Also, profits and floor space are usually well known or easily calculated. FSP is an effective metric for evaluating the effectiveness of a DFA initiative because it captures profitability and the required factory size in one metric. Done well, increasing FSP can avoid the purchase or construction of a new factory.
So, how much floor space is required for product A versus product B and do you reduce the required floor space? A good rule of thumb is that the required floor space is proportional to the work content (value added activities) and waste (non-value added activities) associated with assembling the product. In equation form it’s shown as
Floor Space ┴ VA activities + NVA activities. (eq. 2)
Here’s an example calculation to justify, or at least explain, the rule of thumb. Assume the demand (D) is six units per day and there are six work hours in a day, resulting in a takt time of 1 hour.
takt time = number of work hours / D (eq. 3)
where D = 6, number of hours = 6,
takt time = 6 hours / 6 units = 1 hour per unit.
Assume that the sum of the time VA and NVA activities is 10 hours which results in 10 assembly stations to meet the demand.
Number of Assembly stations = (VA time + NVA time) / takt time (eg. 4)
where VA + NVA times = 10 hours, takt time = 1 hour
Number of Assembly stations = 10 hours / 1 hour = 10.
Now assume that each assembly station requires 100 square feet.
Floor Space = Number of Assembly Stations X Floor Space per assembly station (eq. 5)
where the number of stations = 10, floor space per station = 100 square feet,
Floor Space = 10 X 100 square feet = 1000 square feet.
Now, to demonstrate the rule of thumb that floor space is proportional to VA+NVA time, calculate that whole mess for a product with the same demand but with 5 hours of VA + NVA time (50% reduction). takt time is still one hour because it’s only a function of demand. But equation 4 becomes:
Number of Assembly Stations = 5 hours / 1 hour = 5. (eq. 6)
Using the result of equation 6, equation 5 becomes:
Floor Space = 5 X 100 square feet = 500 square feet. (eq. 7)
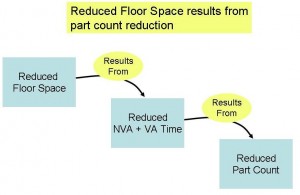
Like before, floor space reduction is at the front of a causal chain where a reduction of floor space results from a reduction of work content (VA activities) and waste (NVA activities) associated with the assembly of the product, which in turn is the result of part count reduction. This causal chain is shown in Figure 5.
So, reduce part count to reduce VA and NVA activities and, ultimately, floor space.
Figure 5. Causal chain of Floor Space, NVA time, NVA activities and part count.
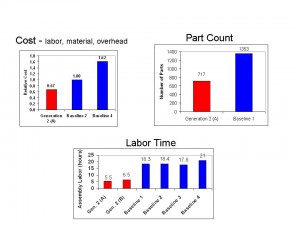
6. Create simple before (A) and after (B) metrics for simple A/B charts sustain momentum
The key to sustaining momentum of a DFA program is a set of simple before and after metrics. See Figure 6 for examples.
Figure 6. Example A/B data.
References
1. Ohno, Toyota Production System, Beyond Large-Scale Production, 1978 (Japanese), 1988 (English).
2. Suzaki, The New Manufacturing Challenge, 1987.
3. Maskell and Baggaley, Practical Lean Accounting, 2004.
4. Presentation by Nick Dewhurst at GE’s Global Research Center, April 2006.

 Mike Shipulski